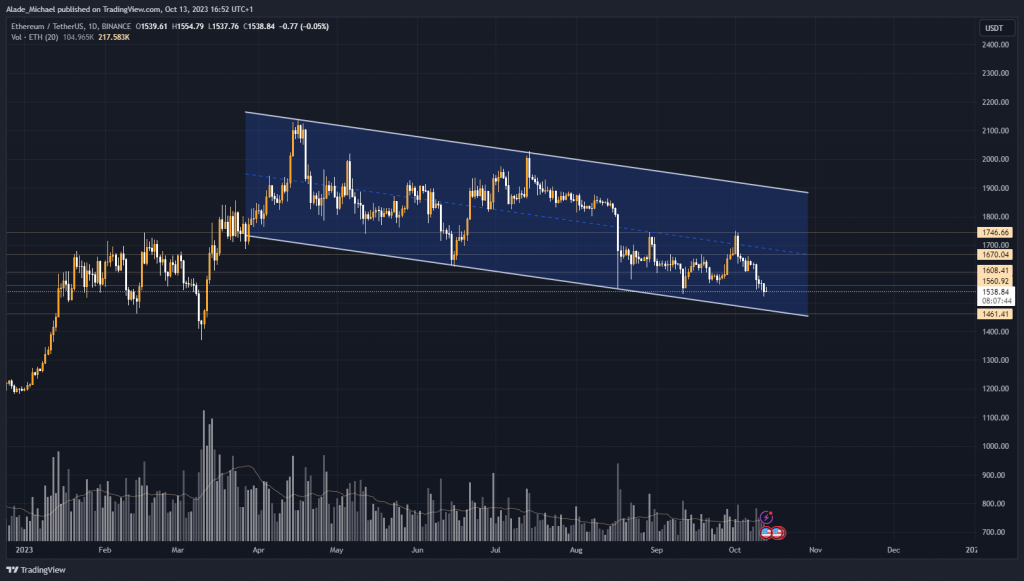
Ethereum resumed a downtrend this month following a three-week recovery from a key support level. The price fell slightly below this support after shedding a 12% loss since the start of the month.
After rising to the $1,751 level as a retest of August’s breakdown, Ethereum saw a rejection there and the price fell throughout last week. It reiterates actions this week and went through the $1,600 level that was held as support last week.
However, the $1,521 level managed to suppress selling pressure yesterday and the price has remained stable ever since. If the pressure resumes in the next few hours, the price may dip to the lower boundary of the channel – which has been serving as support since April.
A further drop in price could bring a test at March’s low before retracing slightly upward. As it stands now, selling volume is low on the daily chart.
On the other hand, there’s still room for an increase. This is if the channel’s lower boundary continues to serve as support. In such a case, the potential retracement level to keep in mind for buying would be $1,900.
The only condition for a bullish reversal is a notable surge above the descending channel. Otherwise, Ethereum’s price would continue to lose momentum until it finds a solid ground level for a buy. Currently, it looks weak on the monthly as the price rolls back in the red zone.
ETH’s Key Level To Watch

If we see a weekly candle close below the $1,500 level, the next target for the bears would be the $1,461 level and $1,368 – tested as March’s low.
The $1,560 support level that broke yesterday is now tested as resistance. In case of a pullback, the $1,608 and $1,670 levels are potential resistance to pay attention to.
Key Resistance Levels: $1,560, $1,608, $1,670
Key Support Levels: $1,461, $1,368, $1,243
- Spot Price: $1,538
- Trend: Bearish
- Volatility: High
Disclosure: This is not trading or investment advice. Always do your research before buying any Metaverse crypto coins.

