RAYDIUM PRICE ANALYSIS & PREDICTION (February 18) – Ray Forms New Bearish Pattern, Sets For a Massive Crackdown

Advancing bearish this week, Ray posted a huge loss in the past hours and now poise for more drops as it forms a classical head-and-shoulder pattern. It currently approaches a key support level for a breakdown.
Last week saw Ray through a recovery after dropping steadily in the preceding week. However, the momentum was short-lived due to a sharp rejection and the price fell back, closing near the opening price.
That triggered a serious drop since yesterday and the price dipped below $5. It is approaching a crucial support level, which has been suppressing bearish pressure for the past three months. If this support holds well, we can anticipate a bounce back. However, things might change this time.
Looking at the latest price actions, which appear more like a classical head-and-shoulder (H&S) pattern on the daily chart, Ray may collapse heavily any moment from now. If this bearish pattern plays out, the target price range to watch is $2.2.
The recent breakdown in Sol and Jup’s price is one of the key indicators to watch for a bearish move. From the look of things, Ray is expected to follow suit anytime soon. In fact, it looks ready for a breakdown while approaching the H&S neckline.
Ray’s daily volume indicator is another thing to consider for a potential drop. A continuous decline in the volume could cause more reduction.
RAY’s Key Level To Watch
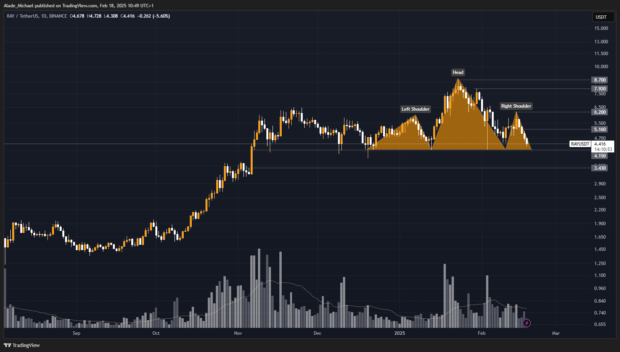
The $4.15 level is the major support to consider for a breakdown. After that, the $3.43 level is the next support to watch, followed by the minor $2.5 level. The main target level is located at $2.2.
Right now, the $5.16 and $6.2 levels are held as support areas. If the price recovers above this area, the higher level for a test would be $7.92.
Key Resistance Levels: $5.16, $6.2, $7.92
Key Support Levels: $4.15, $3.43, $2.2
- Spot Price: $5.3
- Trend: Bearish
- Volatility: High
Disclosure: This is not trading or investment advice. Always do your research before buying any Metaverse crypto coins.