
Ethereum encountered resistance earlier this month and resumed bearish after failing to climb above the $1,750 level during last month’s recovery. It initiated a fresh drop this week and lost 2% in the past hours.
ETH seems technically back in the woods after witnessing a small increase in the past month. It attempted to cross the mid-boundary of the descending channel in the first week of this month, but it faced rejection (at $1,751) and rolled back.
In the second week, the cryptocurrency went through more dips as it temporarily held the $1,521 level as support, and then followed by a minor recovery to $1,640 – this week’s high.
It initiated a drop from there and resumed selling as it flipped through a minor support level earlier today. The price is now approaching the aforementioned support level. An increase in supply could pull the price towards the lower boundary of the descending channel for support.
However, it seems to be gathering volatility at the moment.
Looking at the daily volume indicator, which reveals steady money outflow for the past few months, ETH may continue to register loss until it finds solid ground for an increase. Upon that, there’s a need for an enhanced volume inflow and increased demand to reverse the trend.
With the current bearish setups over the past months, more selling pressure can be expected as the price looks weak on the daily chart.
ETH’s Key Level To Watch
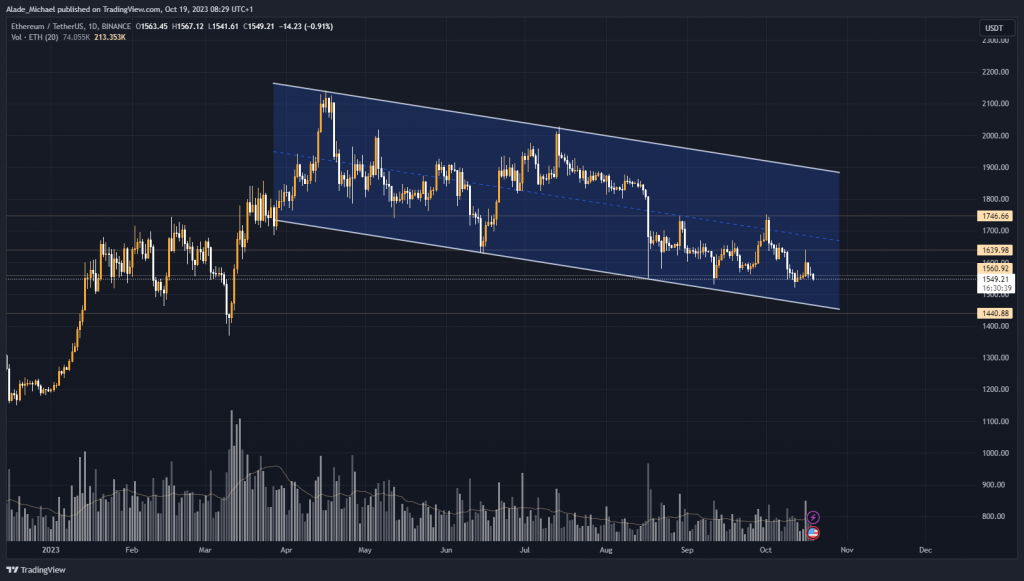
When pressure increases, the next targets for selling would be the $1,500 and $1,440 support levels. If those levels fail to contain pressure, March’s low of $1,369 would be the next stop for the bears.
On the daily chart, the chances of buying look very slim at the moment. But if the asset manages to reclaim the minor $1,560 resistance level (formerly support) that flipped today, the $1,639 and $1,746 resistance levels would be the next buy targets to watch.
Key Resistance Levels: $1,560, $1,639, $1,746
Key Support Levels: $1,500, $1,440, $1,369
- Spot Price: $1,550
- Trend: Bearish
- Volatility: High
Disclosure: This is not trading or investment advice. Always do your research before buying any Metaverse crypto coins.